
ROC-AUC 0.883, AP 0.411 and statistically supported gains over the frozen reference on the integrated ranking metrics.
The 24-month outcome window is incomplete and calibration-in-the-large failed. The appropriate use is ranking and controlled shadow testing.
Background: Credit-risk models can score well for the wrong reasons. Common failure modes include outcome-conditioned cohort selection, accounts that were not yet public at prediction time, overlapping outcome windows, contemporaneous registry snapshots, and fields that indirectly reveal whether a company was later deleted. We therefore built a modelling process in which temporal order and source provenance are treated as part of the statistical model itself, not as downstream data cleaning.
Methods: A proprietary, curated longitudinal reconstruction of publicly available Norwegian registry, annual-accounts and gazette data was anchored to a fixed prediction origin: 31 December of the accounting year. The outcome was bankruptcy opening or forced dissolution within the following 24 months. The model is an ensemble of ten gradient-boosted decision trees over 214 data-driven features plus one deterministic canary. Development and internal validation were separated at the company level; FY2024 served as a later out-of-time evaluation. The improvement over a frozen 198-feature reference was examined with 1,000 paired company-bootstrap draws.
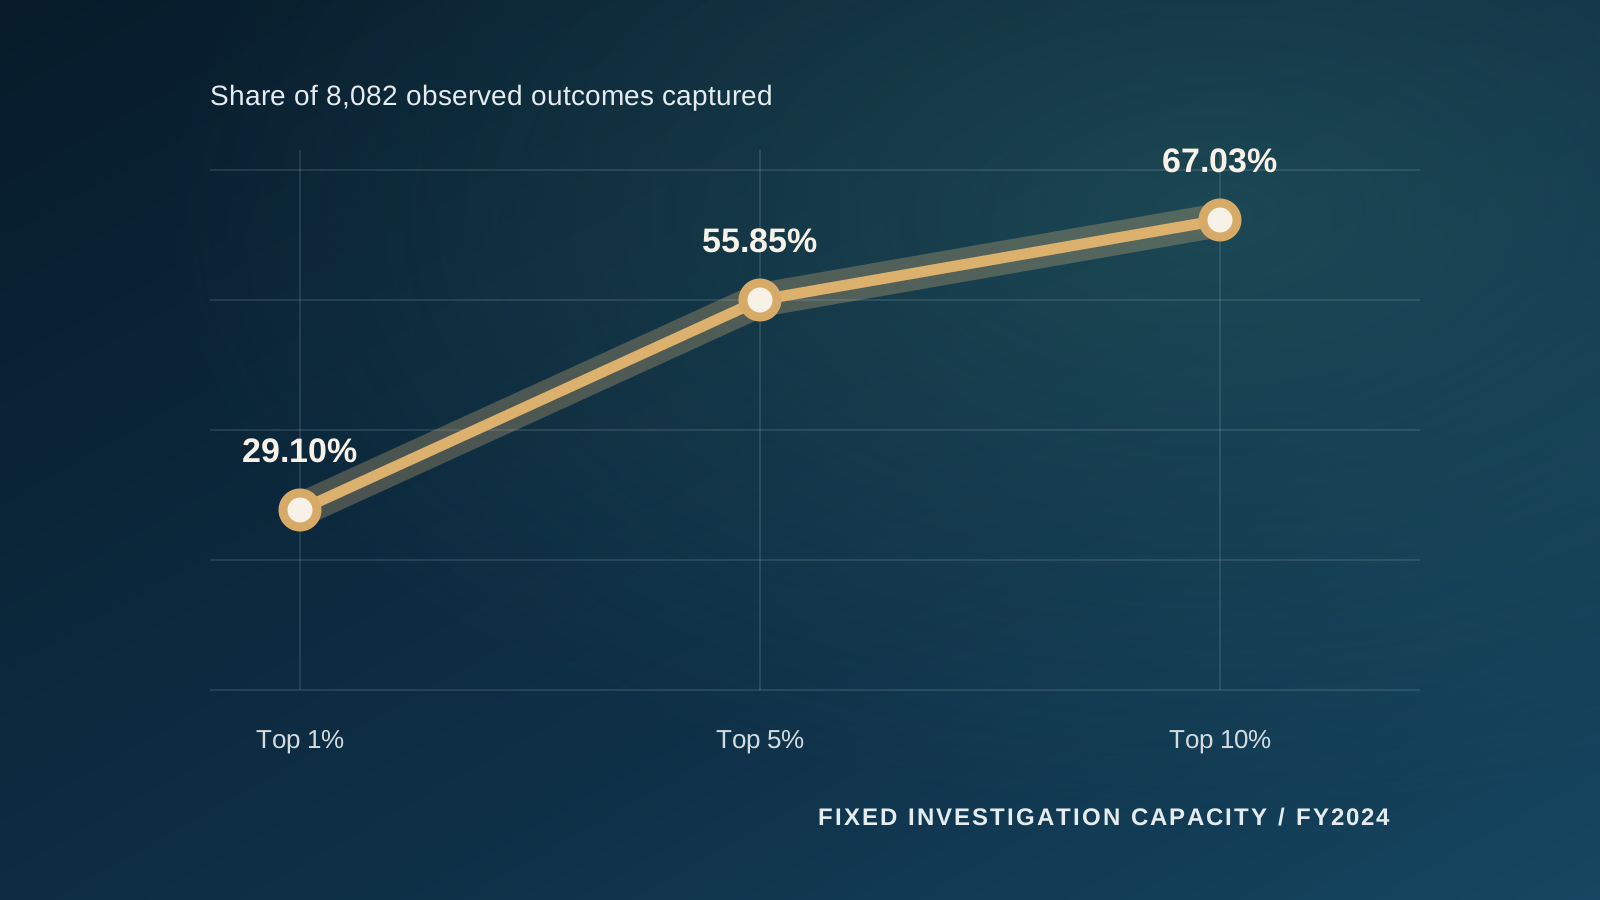
Results: On 375,688 FY2024 companies with 8,082 observed failures, the ensemble reached ROC-AUC 0.8830, average precision (AP — in effect the area under the precision–recall curve, often labelled PR-AUC) 0.4112, standardised partial ROC-AUC at a false-positive rate of up to 10 percent of 0.7680, and a Brier score of 0.0161. The top 1, 5 and 10 percent of the ranking captured 29.10, 55.85 and 67.03 percent of the failures respectively. Against the reference, the difference in ROC-AUC was +0.0037 (95 percent confidence interval +0.0029 to +0.0047) and in AP +0.0132 (+0.0099 to +0.0163). Seed 42 replayed bit-exactly.
Interpretation: The evidence supports strong temporal ranking and a statistically robust incremental improvement. It does not yet support use as a finished absolute 24-month probability: the observed/expected ratio was 1.6216 — a lower bound until the window matures — and the pre-declared calibration-in-the-large gate failed. Moreover, the FY2024 outcome was observed up to 24 August 2026, while the full 24-month window closes on 31 December 2026. The study thus documents a strong development candidate for risk ranking and controlled shadow testing, not an unconditional basis for autonomous credit decisions.
Sammendrag (norsk)Les det norske sammendraget
Bakgrunn: Modeller for kredittrisiko kan oppnå høye skårer av feil grunner: utfallsbetinget kohortseleksjon, regnskap som ikke var offentlige på prediksjonstidspunktet, overlappende utfallsvinduer, samtidige registerbilder og felt som indirekte røper senere sletting. Vi bygde en modellprosess der tidsrekkefølge og kildeproveniens er en del av selve den statistiske modellen.
Metode: En kuratert longitudinell rekonstruksjon av offentlige norske register-, regnskaps- og kunngjøringsdata ble forankret i et fast prediksjonstidspunkt: 31. desember i regnskapsåret. Utfallet var konkursåpning eller tvangsoppløsning de neste 24 månedene. Modellen er et 10-seeds-ensemble av gradientforsterkede beslutningstrær med 214 datadrevne variabler pluss én deterministisk kanari. Utvikling og intern validering ble adskilt på selskapsnivå; FY2024 var en senere ut-av-tid-evaluering. Forbedringen mot en frosset 198-variabelreferanse ble undersøkt med 1 000 parrede selskapsbootstrap-trekk.
Resultater: På 375 688 FY2024-selskaper med 8 082 observerte utfall oppnådde ensemblet ROC-AUC 0,8830, PR-AUC 0,4112, standardisert partiell ROC-AUC (FPR ≤ 10 %) 0,7680 og Brier-skår 0,0161. Topp 1, 5 og 10 prosent av rangeringen fanget 29,10, 55,85 og 67,03 prosent av utfallene. Mot referansen var ΔROC-AUC +0,0037 (95 % KI +0,0029 til +0,0047) og ΔAP +0,0132 (+0,0099 til +0,0163). Seed 42 lot seg gjenskape bit-for-bit.
Fortolkning: Evidensen støtter sterk temporal rangering og en robust inkrementell forbedring, men ennå ikke bruk som ferdig absolutt 24-måneders sannsynlighet: O/E-forholdet var 1,62 og den forhåndsdefinerte kalibrering-i-det-store-porten feilet. FY2024-vinduet er høyresensurert til 31. desember 2026. Studien dokumenterer en sterk utviklingskandidat for risikorangering og kontrollert skyggetesting — ikke et ubetinget grunnlag for autonome kredittbeslutninger.
Read the complete Norwegian edition1. Problem and scientific contribution
Bankruptcy is a rare, time-dependent and administratively recorded outcome. That makes the task harder than ordinary binary classification. A model can rank well because it genuinely detects economic deterioration — but also because it was shown a registry trace that only came into existence after the bankruptcy, because the hardest companies never entered the cohort, or because the same terminal event sits in both the training and the evaluation window. A high ROC-AUC is therefore not, by itself, proof that a model measures future risk.
Our study asks three questions. First: how well can a model rank bankruptcy or forced dissolution within 24 months using only information that was, in principle, available at a common historical cut-off? Second: does the result survive targeted attempts to falsify the signal — time gates, source prohibitions, duplicate controls, block shuffling and an exact replay? Third: does the ranking deliver practical concentration of failures when investigative capacity is limited to the top-ranked 1, 5 or 10 percent?
The contribution is first and foremost methodological. We treat data foundation, cohort, label and model as one connected measurement system. That matters because predictive performance is not merely a property of the algorithm; it is a property of the entire chain from public event to time-stamped feature to evaluated prediction. This reasoning follows the basic transparency of the TRIPOD framework: a prediction study must describe participants, predictors, outcome, validation and analysis precisely enough that the result's applicability and risk of bias can be assessed.
The study is not a comparison with banks or commercial credit-bureau products. We do not have access to their identical portfolios, outcome definitions, time points or decision costs, and such a claim would therefore not be verifiable. The results apply to the defined Norwegian AS/ASA cohort, the defined 24-month outcome and the frozen evaluation described here. The cohort comprises all Norwegian private and public limited companies (AS/ASA) that were at risk at the origin, not only small enterprises; the page's URL reflects an earlier working title.
2. Data foundation and historical outcome reconstruction
The data foundation is Byggsikt's own curated and quality-assured reconstruction of publicly available Norwegian registry, annual-accounts and gazette data. The sources comprise entity information, filed annual accounts and dated announcements from the Brønnøysund Register Centre. The collection infrastructure, the deterministic document interpretation and certain search procedures are proprietary. The scientific description nevertheless reports source category, temporal scope, logical de-duplication, transformation, row counts and cryptographic fingerprints for the model inputs.
The Brønnøysund Register Centre describes the Register of Company Accounts as a central source of insight into the financial condition of Norwegian business. Annual accounts are public, but they represent a reporting process: the accounting year closes, the accounts are adopted, filed and approved later. The ordinary deadline for avoiding late-filing penalties is 31 July of the following year. Accounts for FY can therefore not simply be treated as known on 31 December of FY. Concretely, only accounting years up to and including FY−1 enter as financial predictor information at the origin of 31 December of FY. Where an approval or filing timestamp is observed in the gazettes, it is additionally required to lie on or before the origin; for historical values without such a bound timestamp, temporal correctness rests on the FY−1 shift alone. The residual risk from missing document-level provenance is addressed in section 10.
The outcome was reconstructed from dated public announcements of bankruptcy and forced dissolution. The Bankruptcy Register's announcements contain, among other fields, the organisation number, opening date, case number and judicial venue, and are normally published on the day of the opening. We use event date and organisation number to establish terminal chronology. Voluntary liquidation, merger and demerger are treated as competing exits — neither as survival nor as bankruptcy. A company that already had a terminal outcome before the prediction date does not enter as an at-risk company at that date.
Historical reconstruction was necessary because contemporaneous business registers do not, on their own, represent the past's at-risk population. Companies deleted after bankruptcy may lack rich fields in a later registry extract. If the cohort requires such a field for inclusion, precisely many of the fastest and hardest bankruptcies are removed. We therefore made cohort entry independent of accounts availability. Missing observation is handled inside the feature process itself; it is not used as grounds for removing the company from the population.
Another problem is duplicated physical announcement rows. Count and recency features were therefore built after canonical de-duplication on logical event keys. A duplicate must neither move the date of the most recent event nor increase the event count. For families where the same day can contain conflicting states, a conservative unknown state is applied rather than choosing a favourable ordering that cannot be documented.
| Source category | Temporal role | Use in the study | Principal control |
|---|---|---|---|
| Entity register | Historical identity and status information | Cohort keys and stable company attributes | No contemporaneous "alive/deleted" fingerprints as model features |
| Annual accounts | FY−1 or older at origin | Levels, quality and robust financial transformations | Lagging, pre-origin evidence and source-adjusted shuffling |
| Company and accounts announcements | Date ≤ 31 Dec FY | Recency, capital, auditor, roles and changes | Physical date gate, canonical de-duplication and future-append test |
| Bankruptcy announcements | Date > origin and ≤ origin + 24 months | Outcome reconstruction only | Forbidden in predictor history |
3. Estimand, cohort and time axis
The estimand is the probability that the company's first observed bankruptcy opening or forced dissolution occurs within the 24 months following 31 December of a given accounting year. The study primarily validates the relative ranking of that probability; the absolute level is assessed separately against pre-declared calibration gates in section 8, and did not pass. The prediction date is called the origin. Every feature must be traceable to information dated on or before the origin. A terminal event after the origin is an outcome; the same event can never simultaneously be history in the predictors.
Y(i,t) = 1 if Tfailure,i ∈ (31 Dec t, 31 Dec (t+2)] and no competing exit occurs first; otherwise Y(i,t) = 0 once the full observation window is known.For FY2024 the window is not yet fully observed: companies with no recorded event as of 24 August 2026 are provisionally coded Y = 0 in this report. This right-censoring — an outcome that is unknown, not known to be negative — is treated explicitly in sections 8 and 10.
The cohort aims to represent limited companies that were at risk at the origin. It is therefore not conditioned on whether an annual account exists in a later extract. This point matters: a requirement of an accounts row can look neutral, but companies that fail early often never file their next accounts. "Has accounts" then becomes selection on future survival. In this study the company is retained, while unavailable values are handled by a fit-only process without any model-facing coverage or source flags.
Competing terminal exits are handled chronologically. If voluntary liquidation, merger or demerger occurs before bankruptcy or forced dissolution, the outcome is coded as not having occurred in the window (Y = 0): the competing exit precludes failure, and the company remains in the population. This is a competing-risk treatment of the estimand — the target is the cumulative incidence of failure as the first terminal event — not censoring; the word censoring is reserved for windows that are not yet fully observed, as with FY2024 above. If failure occurs first, the outcome is positive. The principle prevents a company from being described both as excluded and as later positive on the strength of an arbitrary priority between columns. The formally improved chronological label code produces a very small difference against the label version that generated the frozen result; this is reported as a reproducibility limitation later in the article.
One clock for predictors, one later clock for outcomes
Financial observations are lagged behind the origin. No FY accounts value is assumed known at the close of that same FY.
Roles, auditor, capital and changes are physically cut at the origin and de-duplicated.
The company is ranked using only information permitted at this point in time.
Bankruptcy opening or forced dissolution yields a positive outcome; competing exits are handled first-in-time.
FY2024 is not yet fully mature: the remaining window up to 31 Dec 2026 is right-censored in this report.
Development, validation and evaluation roles
The frozen run used 300,863 companies for model fitting and 33,236 companies for internal validation; 765 validation companies had a positive outcome. The split was deterministic on organisation number, so that no company appeared on both sides of the fit/validation boundary. This prevents repeated company-years or stable company characteristics from leaking between the two roles. The FY2024 evaluation consisted of 375,688 companies with 8,082 recorded failures.
With a 24-month horizon, the outcome window of the most recent development vintage partially overlaps the FY2024 evaluation window: the development material extends through FY2023, whose window shares calendar year 2025 with FY2024's, so the same terminal event can serve both as a training label and as an evaluation outcome for the same company. The frozen run was produced with the earlier label vintage, which did not purge such overlapping rows; a purge was introduced only in the later, chronologically corrected label code discussed in section 10. The shared window must therefore be counted among the sources of optimism in this evaluation, alongside the limitations listed there. The row counts for the overlap belong in a future version of the evidence file before they are cited.
The FY2024 evaluation is also out-of-time, not out-of-company: a company that appears in the development material with earlier accounting years also enters the FY2024 cohort with its FY2024 observation. The company-disjoint split applies to the fit/validation boundary within the development material. The generalisation being tested is thus to a later time period for a largely overlapping population of companies, not to unseen companies.
FY2024 is temporally later than the development material and is therefore an out-of-time evaluation. It is nevertheless not an untouched external confirmation cohort. Several development choices were, over time, assessed against FY2024. The confidence intervals in this article therefore describe the uncertainty in the frozen, paired comparison; they do not include the full uncertainty of the earlier adaptive model search. A genuinely blind confirmation requires a new time cohort, or an independent portfolio, that is opened only after architecture, label and analysis plan are locked.
| Role | Companies | Failures | Use |
|---|---|---|---|
| Fit | 300,863 | Not published as a headline estimate | Tree fitting and fit-only imputation |
| Validation | 33,236 | 765 | Early stopping and calibrator, fully company-disjoint |
| FY2024 evaluation | 375,688 | 8,082 | Later temporal performance and paired comparison |
4. Feature architecture: mechanisms rather than field hunting
The frozen candidate has 215 inputs: 214 data-driven features and one deterministic pseudorandom canary. The canary is an audit instrument, not economic information; it is a fixed, outcome-blind function of stable identifiers, so its value is bit-reproducible and by construction independent of the outcome. The data-driven features are organised into families with an explainable mechanism: payment capacity and capital buffer, accounts quality, change intensity and recency, company age, auditor history, industry, and historical connections between persons and other companies.
The accounts block is the largest. Level features preserve information that can vanish in ratios alone, while quality features describe consistency and structure in the available accounts observations. A separate control showed that recomputing 14 traditional financial ratios barely improved the trees; flexible trees could largely form the same splits from the levels. That does not mean accounts are unimportant. On the contrary, a source-adjusted shuffle of the historical accounts block showed that company-specific values carried substantial predictive information. The negative finding concerns redundant transformation, not the accounts source itself.
The recency features measure how many days have passed since particular types of dated announcements. Earlier experiments with a sequence model found no stable added value over a simple count-and-recency representation. The useful finding was that "days since" was consistently more informative than mere counts. The frozen architecture therefore uses a transparent, aggregated event history rather than retaining a volatile sequence model that never beat its own baseline.
Person and auditor networks can be strong, but they are also dangerous. A contemporaneous role snapshot taken years later reveals who was still active — and thereby, indirectly, who survived. We use only dated role events before the origin, identify persons within each historical point in time, and apply leave-one-out with respect to the company being scored. History based on bankruptcy openings is forbidden as a predictor, both because the outcome itself can leak and because public retention of bankruptcy history varies over the calendar. Network signals are instead built from dated, non-terminal warning events with better temporal coverage.
Industry is represented from point-in-time purpose text and official classification, without feeding the model's classifier confidence in as a separate feature. That last point is an important design choice: the confidence of a text classifier can measure how similar the text is to the population the classifier was trained on, and thus become a hidden survival signal. The candidate uses industry information, but not a margin that claims to know when the industry guess is "certain".
| Family | Count | Economic or administrative mechanism |
|---|---|---|
| Control and base features | 53* | Cohort-stable base signals, industry representation and one deterministic canary |
| Event recency | 31 | Time since dated changes, warnings and administrative events |
| Historical person network | 9 | Pre-origin connections to other companies and warning history, leave-one-out |
| Accounts levels | 75 | Liquidity, capital structure, profitability, size and result |
| Accounts quality | 30 | Internal structure and observable quality of historical accounts values |
| Capital history | 9 | Level, change, minimum capital and dated capital events |
| Age and auditor core | 5 | Observed historical age, auditor change and explicit auditor clearance |
| Auditor network, provisional | 3 | Dated engagements and warning recency of other known clients |
* The 53 control and base features include one deterministic canary. The candidate thus has 214 data-driven features, not 215 independent economic signals.
Missing accounts: an observation problem, not automatically an economic property
Missing accounts values can arise because the company did not file, because the public history is limited, because the document was retrieved through a different historical channel, or because a field is not applicable. If the model is given an explicit "source", "retrieved" or "recovered" flag, it can learn the data-collection process instead of credit risk. Such model-facing provenance and coverage flags have therefore been removed.
Numerical gaps are filled deterministically from donors selected in the fit population only, primarily within industry group, and without reading the label. Observed cells are preserved. This prevents evaluation data from influencing the imputation and makes the missingness treatment outcome-neutral. The method is nevertheless not equivalent to multiple imputation and does not express full uncertainty about each missing value. Robustness is therefore also assessed by shuffling and by comparison against an independent accounts panel on overlapping companies.
5. Model and training design
The model family is gradient-boosted decision trees for a binary outcome. Trees are well suited when financial levels, event recency and network signals carry thresholds and interactions that are not necessarily linear. The architecture was frozen before the final ten-seed run. Each member used 63 leaves, learning rate 0.05, 80 percent random feature sampling per iteration, 80 percent row sampling, at least 100 observations per leaf and a raw class weight of 1.0. Early stopping used a patience of 100 iterations without improvement in validation-set ROC-AUC as its stopping criterion; the best iteration for seed 42 was 320 (section 6). The hyperparameters were selected in the preceding development process described in section 3 — a process that was not blind to FY2024 — and then frozen before the ten-seed run. The uncertainty attached to that selection is not represented in the reported confidence intervals.
Seeds 42–51 varied the row and feature subsampling, while the data split and all other contracts were held constant. The ensemble prediction is the mean of the ten model predictions. This reduces seed-dependent variance and makes the comparison less sensitive to a single lucky initialisation. We report both the ensemble and the distribution of individual seeds. The ensemble is the frozen model; the mean of single-seed metrics is not the same as the metric computed on the mean prediction.
Model fitting used ROC-AUC for early stopping, but the assessment of results was multi-metric. ROC-AUC measures the probability that a randomly drawn positive observation is ranked above a randomly drawn negative one. At 2.15 percent prevalence, ROC-AUC can conceal low precision, so PR-AUC is a central measure. In addition we report standardised partial ROC-AUC at a false-positive rate of up to 10 percent, Brier score, log-loss, calibration slope, calibration-in-the-large, expected calibration error and capture at fixed investigation budgets. The partial ROC-AUC is standardised so that, within the FPR region, 0.5 corresponds to chance ranking and 1.0 to perfect ranking; the raw partial area on FPR ≤ 0.10 would have a maximum of 0.10.
Probabilities were calibrated with a logistic Platt transformation estimated exclusively on the validation set. Calibration changes the level and spread of the probabilities but not the ranking when the transformation is monotone. It is therefore possible for ROC-AUC and PR-AUC to be good while the absolute probability is wrong. Precisely this happened in FY2024, and it is treated as a finding, not as a cosmetic detail. The validation set has two roles — early stopping for each ensemble member and estimation of the calibrator — and the roles share the same 765 outcomes, which can produce a mildly optimistic calibrator. Since the level gate failed in FY2024 regardless, this does not change the study's verdict, but a production calibrator should be estimated on data that did not also govern early stopping.
p̄i = (1/10) Σs=4251 pi,s and logit(pi,cal) = αval + βval · logit(p̄i)The canary feature was deterministic pseudorandom and was included in the frozen feature contract. That makes the audit trail reproducible, but also means it was not merely an external diagnostic: the trees could, in principle, split on it. A finally deployable model must be refitted and validated without the canary. The results in this article describe the actually frozen 215-input model and do not conceal this deviation.
The canary cannot be read off with gain-based feature importance: a continuous noise column always offers split points to a greedy tree learner and attains positive gain without carrying information. A canary check on trees must therefore use permutation importance or another label-breaking measure. The frozen run did not store such a reading, and the canary's contribution consequently cannot be cleared retrospectively (section 10).
6. Falsification and leakage audit
The term "leakage-free" is often used too loosely. A column can be free of the label itself and still carry a perfect fingerprint of future status. We therefore defined leakage as any information path through which the model gains access to events, registry states, source provenance or selection mechanisms that were not available for the business in question at the origin. The definition also covers the selection procedure itself: a field list chosen with knowledge of evaluation labels is leakage, even if every individual column is point-in-time clean in isolation.
The audit regime combines static contracts and empirical falsification tests. Static contracts reject forbidden sources, require a unique key per organisation number and accounting year, verify that the number of post-origin rows is zero, and hash SQL, code, feature order and artefacts. Empirical tests verify that duplicates do not change the result, that future rows can be appended without altering historical features, that source flows show no suspicious calendar growth, and that company-specific values lose power when shuffled within preserved source and time strata.
Six gates between raw public event and model feature
All dated predictors must have an event date on or before 31 December of the FY in question. Measured post-origin row count: zero in the newly audited families.
Contemporaneous role and ownership snapshots, outcome-derived bankruptcy history and source identifiers are explicitly forbidden as model inputs.
The same logical announcement counts once. Collisions and unknown ordering are handled conservatively rather than guessed.
Donors are chosen among fit companies only, without label reading. No source, donor, coverage or missingness flag reaches the model.
Company-specific accounts values are shuffled while source and time patterns are preserved. Loss of performance shows the values, not merely the provenance, carry signal.
Feature order, runs, freeze contract and proof receipt are cryptographically bound. Seed 42 produced an identical prediction vector on re-run.
The gates are not theoretical precautions; each answers an error class that actually occurred and was measured during development. The prohibition on contemporaneous role snapshots (gate 02) derives from an identity key that had been disambiguated against a later registry snapshot and thereby carried survival information into the person graph. The prohibition on source and coverage flags (gate 04) derives from a sentinel value and geographic indicators that in practice identified the collection channel of recovered, predominantly dissolved companies. The retention screen and the ban on bankruptcy-derived history derive from features that grew with the source's deletion window rather than with company risk. The stratified shuffling (gate 05) derives from a feature family whose control arms showed that the entire contribution lay in the availability pattern, not in the values. The requirement of frozen contracts on both sides of any comparison derives from one feature selection that had read the evaluation year's labels, and from one stored reference prediction with a different column contract than the valid comparator.
Point-in-time and duplicate gates
The capital, recency and person-network builders reported zero post-origin rows, full key coverage and unique organisation-number–FY keys. The recency and capital families passed the future-append test: if later source rows are appended, earlier company-years must remain bitwise unchanged. Both families also passed the logical duplicate tests. This is stronger than writing a date condition in SQL; the test challenges whether the condition actually protects the finished artefact.
Retention was checked by comparing source flows and feature distributions from FY2021 to FY2024. Symmetric growth above 1.5 times triggers suspicion of a calendar or retention signal. The newly selected families passed this screen. An auditor-network rate with weaker methodological grounding was expressly excluded, even though it could have improved a development number. Negative and rejected results are part of the model's evidence, because they show that access to a feature did not automatically lead to admission.
Negative control for the accounts block
The largest residual concern was that historical accounts values came from several retrieval layers. If "where the value came from" was correlated with later outcomes, the model could learn the source instead of the economics. In a pre-declared single-seed falsification, the entire 57-feature historical accounts and quality block was shuffled jointly between companies within strata preserving accounting year, industry and observability pattern. 709,772 rows were moved to a different company, without label reading.
The genuine block beat the control by +0.04143 ROC-AUC, +0.16523 PR-AUC and 839 additional hits in the top 1 percent. This is not a complete proof of causality, but it refutes a simple explanation in which the whole accounts contribution is due to source or coverage patterns. An independent panel reconciliation of 14 central accounts measures further showed roughly 99.4–99.9 percent agreement within a tolerance of max(NOK 1,000, 0.1 percent) on overlapping observations.
For feature families with low coverage, development additionally used control arms in which only the availability mask, shuffled values with the missingness pattern preserved, or placebo copies of existing fields were offered to the model; one family in which the mask alone reproduced the entire gain was rejected before freezing. The shuffling control in this section is the frozen, pre-declared variant of the same principle.
Exact replay and immutable receipts
The final run stored one proof receipt, not all intermediate boosters and prediction files. The code, feature order, freeze and input artefacts were bound with SHA-256. Seed 42 was then re-run under the same contract. The best iteration was 320 in both runs, the maximum absolute difference between the evaluation predictions was 0.0, and the prediction hash was identical.
7. Results: discrimination and incremental value
The frozen ten-seed ensemble reached ROC-AUC 0.8830 and average precision (AP) 0.4112 in FY2024. Standardised partial ROC-AUC at a false-positive rate of up to 10 percent was 0.7680. The Brier score after validation-based calibration was 0.0161, and log-loss was 0.0724. All figures were computed on the same evaluation population of 375,688 companies and 8,082 observed failures. The tables, the status banner and metodegrunnlag.json give full precision; running text is rounded to three or four decimals. For reference, an information-free model that always predicts the prevalence attains a Brier score of p(1 − p) = 0.021050; the low absolute Brier value chiefly reflects the low prevalence and must be read relative to it, not as free-standing evidence of good calibration.
AP is used because the outcome is rare. A random ranking has an expected precision near the prevalence — the share of companies with an observed outcome in the window, 8,082/375,688 = 0.021513. An AP of 0.4112 does not mean that all companies above a given threshold carry 41 percent risk; it is a ranking-wide measure summarising precision at different sensitivity levels. Absolute probability must be judged by the calibration measures in the next section.
| Measure | Reference, 198 | Candidate, 215 | Difference |
|---|---|---|---|
| ROC-AUC | 0.879204 | 0.882950 | +0.003746 |
| Average precision (AP) | 0.398033 | 0.411187 | +0.013153 |
| Standardised partial AUC, FPR ≤ 10% | 0.761633 | 0.768019 | +0.006387 |
| Brier score | 0.016343 | 0.016147 | −0.000195 |
| Hits in top 1% | 2,333 | 2,352 | +19 |
| Hits in top 5% | 4,404 | 4,514 | +110 |
| Hits in top 10% | 5,335 | 5,417 | +82 |
Paired company bootstrap
To isolate the difference between candidate and reference, both models were evaluated on the same companies, and the same company sample was used for both models in each of 1,000 bootstrap draws. FY2024 has one row per company, so the company cluster and the row coincide in this cohort. The intervals are percentile intervals from the paired difference distribution. They are not adjusted for the fact that seven measures are reported simultaneously; they should be read as per-measure 95 percent intervals, not as simultaneous coverage for the whole set, and no single conclusion in the study rests on the weakest of several intervals. The intervals also condition on the two frozen models and express only sampling uncertainty in the evaluation cohort; uncertainty from refitting the models (other seeds or training samples) is not included, nor — as section 10 discusses — is optimism from the adaptive development process. The Brier improvement, invisible on the percentage-point axis of Figure 3, was +0.000195 (95 percent CI +0.000149 to +0.000243).
The candidate improves most measures; top 1 percent crosses zero
Risk concentration at fixed investigation capacity
A risk model is often used as a prioritisation tool: how many real events can be examined when the organisation only has capacity to review a limited share of the company population? The candidate captured 2,352 failures among the 3,756 highest-ranked companies. That corresponds to 62.62 percent precision and 29.10 percent sensitivity; precision was thus 29.11 times the prevalence (lift 29.11). At five percent capacity, 4,514 failures were captured; at ten percent, 5,417.
Share of observed failures captured at three review budgets
Stability across seeds
The individual models had a mean ROC-AUC of 0.8781 with a standard deviation of 0.0012, and a mean AP of 0.3934 with a standard deviation of 0.0030. The ensemble was better than every single member on both ranking measures. This is expected when averaging reduces idiosyncratic variation between the trees, but it also shows why the ensemble metric must not be confused with the mean of the seed metrics.
Ten individual seeds and the frozen ensemble
8. Calibration, economic utility and the gate that failed
Discrimination answers who should be ranked higher. Calibration answers whether "three percent risk" actually means roughly three events per hundred comparable companies. That distinction is decisive in credit use. A poorly calibrated model can still prioritise reviews efficiently, but it should not be used directly as a pricing basis, loss estimate or absolute probability of default.
In FY2024 the observed event rate was 2.151 percent, while the mean calibrated prediction was 1.327 percent. The observed/expected ratio was thus 1.6216: the overall observed risk was 62 percent higher than the model expected. Calibration-in-the-large — the intercept of a logistic recalibration of the outcome on the predicted logit, reported on the logit scale — was +0.6616 and broke the locked bound |CITL| ≤ 0.25. At the same time, the calibration slope of 0.9638 lay within the 0.7–1.3 interval, and the ten-bin ECE of 0.00825 lay within the 0.01 bound. The model thus had reasonable relative spread but the wrong overall level.
Because the predictions are frozen and maturation until 31 December 2026 can only add observed events, the O/E ratio of 1.62 is a lower bound for the fully mature window: the underprediction of the overall level will persist or grow with maturation — it cannot mature away. The discrimination and AP figures, by contrast, can move in either direction.
Two calibration gates passed; the level gate failed
As a prioritisation model, the candidate concentrated outcomes better than indiscriminate prioritisation at thresholds from one to twenty percent in the stored analysis, but such analyses alone cannot fix a business rule. The cost of a false positive, the loss from a missed bankruptcy, case-handling capacity and explainability requirements must be defined by the concrete use. The practical conclusion is therefore twofold: the ranking can be tried in controlled shadow testing; the probability must be recalibrated and monitored before it enters pricing or credit limits.
9. Subgroups and where the model is weaker
Average performance can conceal segments in which the ranking is substantially worse. The age analysis shows the greatest weakness among companies younger than two years: ROC-AUC 0.781. For companies between two and five years, ROC-AUC was 0.877, and for companies between ten and twenty years, 0.906. AP also varies, but it is directly affected by differences in event prevalence between the groups — shown in the table — and cannot be compared without that context.
| Company age | Companies | Failures | Event rate | ROC-AUC | AP |
|---|---|---|---|---|---|
| Under 2 years | 54,672 | 1,691 | 3.09% | 0.780867 | 0.288329 |
| 2 to under 5 years | 79,114 | 2,373 | 3.00% | 0.876846 | 0.554010 |
| 5 to under 10 years | 88,435 | 2,149 | 2.43% | 0.894929 | 0.420735 |
| 10 to under 20 years | 95,375 | 1,327 | 1.39% | 0.906428 | 0.365802 |
| 20 years or more | 58,092 | 542 | 0.93% | 0.895068 | 0.291086 |
Among industry divisions with at least 1,000 companies and 20 failures, ROC-AUC ranged from roughly 0.797 to 0.934. Neither the age nor the industry estimates carry their own bootstrap intervals in the frozen receipt; differences between neighbouring groups should therefore be read as descriptive heterogeneity signals, not as a ranking of which industries the model "masters". Before production use, minimum segment sizes, per-segment calibration and a fallback for high-uncertainty groups must be defined.
The youngest companies have both short accounts histories and fewer dated administrative events. The lower AUC is therefore mechanistically plausible: the most important data sources have simply had less time to observe the company. A product presenting a single risk score should surface this information limitation and not convey the same impression of certainty for a one-year-old company as for a ten-year-old one.
10. Limitations and remaining evidence
First, the FY2024 outcome is not fully mature. The administrative read-out stops at 24 August 2026, while a complete 24-month window after 31 December 2024 closes on 31 December 2026. Companies failing in the final months are provisionally treated as having no observed outcome. The headline results must therefore be updated when the window is complete. The discrimination and AP figures can move in either direction as late events are recorded; as section 8 explains, the O/E ratio of 1.62 is a lower bound and can only persist or grow.
Second, FY2024 is temporally held out but not untouched. The evaluation year was seen repeatedly in the broader development process, and — a distinct mechanism described in section 3 — the 24-month outcome window of the last development vintage overlaps the evaluation window, without a purge in the frozen run. The paired bootstrap is valid for the frozen candidate against the frozen reference on this cohort, but it cannot correct optimism from all earlier choices. The next strong piece of evidence is a pre-registered time cohort that is not opened until every design choice is locked, or an independent portfolio with the same origin and outcome definition.
Third, the accounts clock is secured by the FY−1 rule and pre-origin approval traces, but the frozen evidence chain does not hold document-level filing, publication and revision timestamps for every individual historical value. Source-adjusted shuffling and high agreement with an independent panel reduce the suspicion that the entire signal is provenance, but they do not replace full document-bound point-in-time provenance. Our claim is therefore limited to leakage resistance under the implemented tests.
Fourth, the proof run was produced with an older label SQL than the later, chronologically corrected version. A read-only comparison found eight fewer qualifying FY2022 rows, of which six were failures, and four fewer FY2024 rows, all failures, under the corrected chronology. No shared row changed event status. The difference is small relative to 375,688 evaluations, but a strict final reproduction must bind the model to the corrected label code and re-run the frozen analysis.
Fifth, the deterministic canary remained a model input. Its final contribution was not stored, and it therefore cannot be declared irrelevant in hindsight — and, as section 5 explains, a gain-based importance reading could not have cleared it even if it had been stored. The deployable architecture must be refitted without the canary and show that the performance and the bootstrap conclusions stand. Likewise, the person network carries an open question about the completeness of negative edges: a positive event table can prove observed connections, but not always that the absence of a connection means genuine absence.
Sixth, the frozen deliverable is a metrics-and-architecture receipt, not a complete production package. Intermediate boosters, prediction vectors, the training matrix and the bootstrap draws were deliberately not stored, to limit artefact growth. That was right for a development audit, but it means a deployable model file, dependency lock, scoring contract, monitoring regime and operational test must be built separately. Reliability-bin data were not stored either, so a full reliability curve cannot be drawn from the final receipt without a newly bound prediction artefact.
Seventh, absolute calibration is insufficient and performance is heterogeneous. An AUC of 0.781 among the youngest companies may be too weak for certain decisions. Production use therefore requires purpose-specific threshold selection, segment analysis, recalibration, monitoring of population and prevalence drift, and a clear human override process. The model is not validated for other legal forms, other countries, all types of company termination, or regulatory capital purposes.
Finally, no internal study can establish that the model "beats banks" or named credit bureaus without identical companies, origin dates, outcomes, maturity and measurement criteria. Such comparisons require a shared blind test. Our measurable claim is narrower and stronger: in the defined FY2024 cohort, the frozen candidate ranked the observed failures well and beat its frozen reference on the pre-reported headline measures.
| Claim | Evidence | Verdict |
|---|---|---|
| Strong ranking in FY2024 | AUC 0.882950; AP 0.411187; top-5 sensitivity 55.85% | Supported in the observed cohort |
| Better than the frozen reference | Paired intervals above zero for AUC, AP, partial AUC, Brier and top 5/10% | Supported, conditional on the comparison |
| Top 1% is significantly better | Δ sensitivity +0.246 pp (point difference +0.235 pp); CI −0.210 to +0.691 | Not established |
| Leakage-free in an absolute sense | Extensive tests, but residual accounts and label provenance and a shared outcome window | Cannot be proven absolutely |
| Finished 24-month probability | O/E 1.6216 (a lower bound while the window matures); CITL gate failed; the cohort is immature | Not supported |
| Production-ready model package | No deployable booster or complete scoring package in the receipt | Not yet |
11. Conclusion
Byggsikt Risiko 24 shows that self-curated public Norwegian registry, accounts and gazette data can deliver strong, practically useful ranking of bankruptcy and forced dissolution. On 375,688 FY2024 companies with 8,082 observed failures, the ten-seed ensemble reached ROC-AUC 0.8830 and AP 0.4112. The five percent highest-ranked companies contained 4,514 of the failures. The improvement over the frozen 198-feature reference was positive with paired 95 percent intervals for AUC, AP, partial AUC, Brier and sensitivity at five and ten percent capacity.
The most important scientific value, however, is not one decimal number. It lies in the fact that several attractive results were withdrawn when they proved to be driven by cohort selection, the wrong clock, source provenance, calendar variables or missingness patterns. The chosen model is what remains after time gates, source prohibitions, de-duplication, fit-only imputation, negative shuffling controls, hash binding and bit-exact replay.
The verdict is precise: the model is a strong, reproducible development candidate for risk ranking and controlled shadow testing. It is not yet a fully calibrated probability model or an autonomous credit decision. Before such use, the FY2024 window must mature, the corrected label code must be bound, the canary removed, the probability recalibrated, and a deployable package validated on a new locked cohort. Reporting these boundaries does not weaken the model. It is what makes the result defensible.
Citation, version and declarations
How to cite this study
Byggsikt Data. "Point-in-time prediction of bankruptcy and forced dissolution in Norwegian limited companies: development, adversarial audit and out-of-time validation of a 24-month risk model." Byggsikt, 29 August 2026. Preliminary validation study, version 1.0, English edition. https://www.byggsikt.no/rad/konkursrisiko-norske-smaforetak/en
@techreport{byggsikt2026risiko24en,
  author      = {{Byggsikt Data}},
  title       = {Point-in-time prediction of bankruptcy and forced dissolution in Norwegian limited companies},
  institution = {Byggsikt},
  year        = {2026},
  month       = {8},
  type        = {Preliminary validation study, version 1.0, English edition},
  url         = {https://www.byggsikt.no/rad/konkursrisiko-norske-smaforetak/en},
  note        = {English edition of the Norwegian original at https://www.byggsikt.no/rad/konkursrisiko-norske-smaforetak/. Proof receipt SHA-256 333a0762d10ba574...; evidence in metodegrunnlag.json}
}
Version and status
Version 1.0, published 29 August 2026. This page is the English edition of the Norwegian original, which is the version of record; the two editions carry identical numbers. The study is a preliminary validation study: the FY2024 outcome is right-censored until 31 December 2026, and the headline figures will be updated in a version 1.1 when the window is complete. All headline results and comparison figures are reproduced in metodegrunnlag.json. Certain process and falsification figures — among them the shuffling control and panel reconciliation in section 6, the architecture parameters in section 5, the subgroup range in section 9 and the label-SQL comparison in section 10 — exist so far only in the SHA-256-bound proof receipt and are not independently verifiable from the public evidence file; they are scheduled for inclusion in its next version. Changes occur only through new, dated versions of this page.
Conflicts of interest and funding
The study was conducted and funded by Byggsikt, which develops the model it describes, for use in its own services. There is an obvious self-interest in a positive result. The counterweight is methodological and explicit: pre-declared gates that were allowed to fail and are reported as failed, paired confidence intervals also where they weaken the conclusion, negative controls, and a verdict that limits use to ranking and shadow testing. No external clients have influenced the design or the reporting.
Data availability
The sanitised evidence file is public in metodegrunnlag.json and bound to the publication with cryptographic fingerprints. The raw data derive from publicly available Norwegian registry sources; Byggsikt's collection and interpretation infrastructure is proprietary and is not published. External full reproduction is therefore limited, and this is stated as an explicit limitation in section 10.
References and methodological sources
- Brønnøysund Register Centre. About the Register of Company Accounts. Public availability, filing process and ordinary deadline for annual accounts.
- Brønnøysund Register Centre. Announcements from the Bankruptcy Register. Content and publication of bankruptcy and forced-dissolution announcements.
- Brønnøysund Register Centre. Central Coordinating Register open-data documentation. Technical services, data fields and public licence.
- Collins GS, Reitsma JB, Altman DG, Moons KGM. The TRIPOD statement. BMJ. 2015;350:g7594.
- Moons KGM et al. PROBAST+AI. Updated tool for quality, risk of bias and applicability in prediction models.
- Saito T, Rehmsmeier M. The Precision-Recall Plot Is More Informative than the ROC Plot When Evaluating Binary Classifiers on Imbalanced Datasets. PLOS ONE. 2015;10(3):e0118432.
- Van Calster B et al. Calibration: the Achilles heel of predictive analytics. BMC Medicine. 2019;17:230.
- Efron B, Tibshirani RJ. An Introduction to the Bootstrap. Chapman & Hall/CRC; 1993.
- Friedman JH. Greedy Function Approximation: A Gradient Boosting Machine. Annals of Statistics. 2001;29(5):1189–1232.
The headline results in this publication are bound to the sanitised public evidence file; the process figures cited in sections 5, 6, 9 and 10 are bound to the proof receipt. Source code, raw data and certain collection procedures are not published because they form part of Byggsikt's proprietary data infrastructure. This limits external full reproduction and is therefore stated as an explicit limitation.